The Four DORA Metrics That Define Modern Software Delivery

Introduction: Why Measuring Software Delivery Is Hard
For decades, the software engineering industry has grappled with a persistent and often frustrating challenge: how do you accurately measure productivity and effectiveness in a domain built on creativity, problem-solving, and constant evolution? Historically, attempts to quantify engineering output have often fallen short, leading to misguided strategies and unmet expectations.
We have seen countless organizations cling to traditional metrics that, while seemingly logical, ultimately fail to paint a complete or accurate picture. Metrics like "lines of code written" are easily gamed and bear little correlation to actual value delivered. "Developer utilization rates" often encourage busyness over impact, fostering a culture where looking busy is prioritized over shipping high-quality software. Even "story points velocity," a staple of agile methodologies, can become an internal-facing measure that, when weaponized, drives teams to inflate estimates or sacrifice quality for perceived speed, rather than focusing on the actual outcomes for users and the business.
The fundamental flaw in these traditional approaches is their focus on activity or output rather than outcomes. Within the complex, adaptive nature of software delivery, simply tracking what engineers do does not tell you if what they are doing is actually effective, valuable, or sustainable. We need a shift in perspective, moving from internal process metrics to external, outcome-oriented delivery metrics that reflect the health and performance of the entire software delivery system.
This is where DORA enters the conversation. The DevOps Research and Assessment (DORA) group has revolutionized how we think about software delivery performance, providing a robust, research-backed framework that has fundamentally reshaped industry discourse. This article will delve into the four core DORA metrics, explaining what they measure, why they matter, and how they work in concert to define modern software delivery success. We will explore their power to foster better conversations, drive meaningful improvements, and align engineering efforts with business objectives.
What this article will not cover are the intricacies of setting up DORA metric collection tools, nor will it prescribe specific technical solutions. Our focus is on the foundational understanding and strategic application of the metrics themselves.
What Is DORA and Why It Matters
DORA originated as an independent research group founded by Dr. Nicole Forsgren, Jez Humble, and Gene Kim. Their work was distinctive not because it promoted DevOps practices, but because it applied rigorous, statistically valid research methods to software delivery at scale.
Rather than relying on anecdote or vendor opinion, DORA analyzed data from thousands of organizations across industries, geographies, and company sizes. The goal was not to define best practices, but to identify measurable capabilities that correlate with high organizational performance.
One of DORA’s most significant contributions was demonstrating that speed and stability are not opposing forces. High-performing teams do not trade reliability for velocity. Instead, they achieve both simultaneously through system-level capabilities. This insight fundamentally changed executive conversations. Delivery performance could now be discussed in terms leaders understood: outcomes, predictability, and risk reduction — without resorting to proxy measures like team utilization or release counts.
DORA metrics matter because they:
- Are empirically validated, not opinion-driven
- Measure system performance rather than individual effort
- Apply across technology stacks and organizational models
- Encourage architectural and process improvements instead of local optimization
It's important to address common misconceptions about DORA. These metrics are not about micro-managing individuals or teams. They are diagnostic tools for the system of software delivery. They don't dictate how you should achieve high performance, but rather where your system might be constrained and what the outcomes of your current practices are. Furthermore, DORA is not a one-time assessment; it's a continuous feedback loop that enables ongoing improvement and learning.
The Four DORA Metrics: An Overview
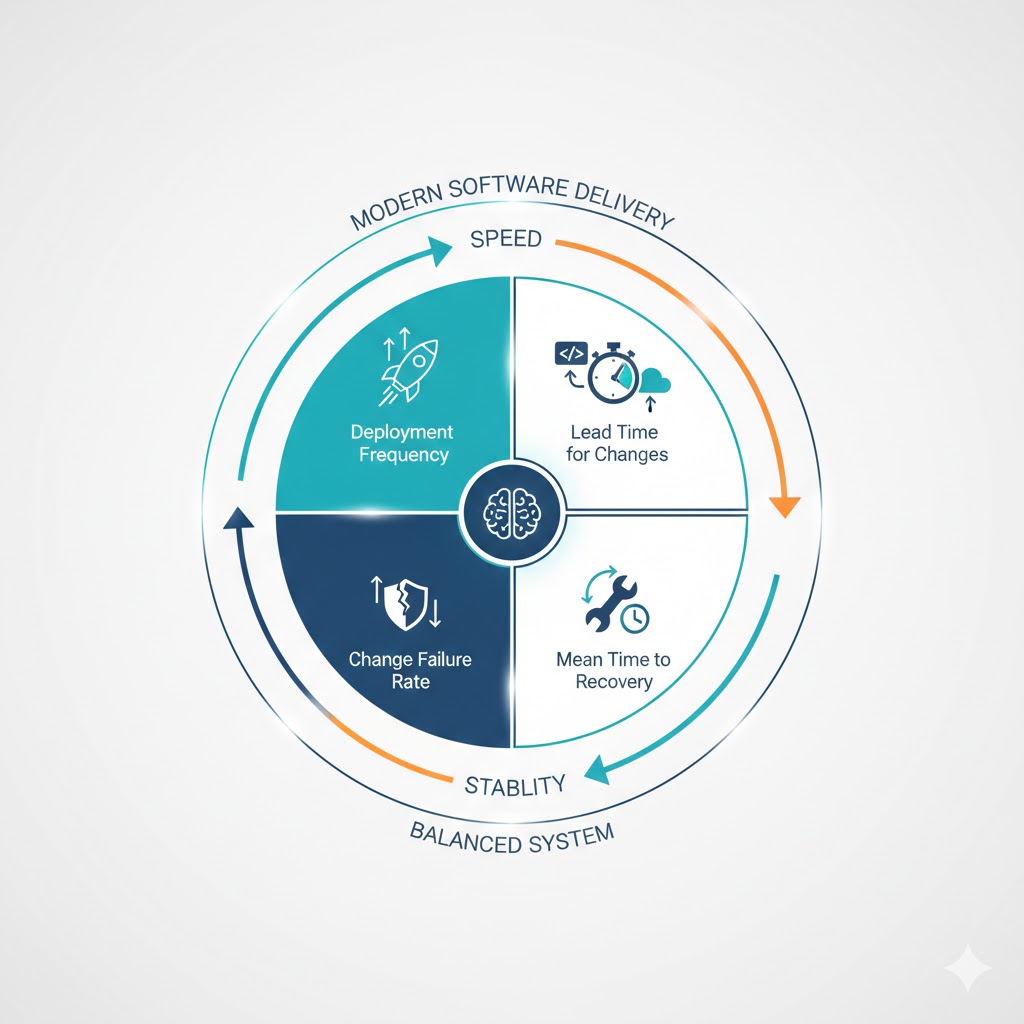
At its core, DORA recognized that high-performing organizations excel in two critical dimensions: flow (the ability to rapidly deliver value to customers) and stability (the ability to deliver that value reliably and maintain operational excellence). The four DORA metrics below are designed to capture these two dimensions comprehensively.
- Deployment Frequency
- Lead Time for Changes
- Change Failure Rate
- Mean Time to Recovery (MTTR)
Individually, each metric provides a partial view. Together, they form a balanced measurement system that captures both delivery speed and delivery stability.
Two metrics focus on flow:
- Deployment Frequency
- Lead Time for Changes
Two metrics focus on stability:
- Change Failure Rate
- Mean Time to Recovery
No single metric is sufficient to define modern software delivery; instead, they work in concert to reveal the underlying health of an organization's development and operations practices.
These metrics inherently demonstrate that the perceived trade-off between "speed" and "stability" is largely a false one in high-performing organizations. The research consistently shows that elite performers excel in all four metrics simultaneously, proving that it is possible to deliver rapidly and reliably. Trying to optimize for one at the expense of another inevitably leads to systemic imbalances and suboptimal outcomes. For instance, focusing solely on speed without regard for stability can lead to frequent outages and burnout, while an overemphasis on stability without agility can result in slow innovation and missed market opportunities.
Metric - Deployment Frequency
Deployment Frequency measures how often an organization successfully deploys code to production (or to an environment that directly serves users).
What It Measures
Deployment Frequency quantifies how often an organization successfully releases changes to production or releases to end-users. This is not just about deploying code; it includes any changes that impact users, such as configuration updates, database schema changes, or infrastructure modifications.
Why It Matters
This metric is a strong indicator of an organization's "batch size" and its overall delivery flow. High deployment frequency typically correlates with smaller, more manageable changes. Smaller changes are inherently less risky because there is less to go wrong, and they are easier to revert if issues do arise. Frequent deployments enable faster feedback loops from users, allowing teams to quickly validate hypotheses, correct course, and adapt to market demands. It fosters a culture of continuous delivery, reducing the stress associated with large, infrequent "big bang" releases.
What It Does Not Measure
Deployment Frequency is not a measure of individual developer productivity. It does not tell you how many lines of code someone wrote or how many tasks they completed. Nor does it, in isolation, measure the quality of the code being deployed. A high deployment frequency with a high change failure rate suggests a problem, not success.
Common Misinterpretations
One common misunderstanding is that simply deploying more often automatically equates to better delivery. While generally true for high performers, artificial inflation through trivial, non-value-adding changes can distort the metric. For example, deploying empty commits or solely documentation updates just to boost the number does not reflect improved delivery flow for end-users.
The goal is to deliver valuable changes frequently, not just any changes frequently.
Another misinterpretation is to focus purely on the number of deployments, ignoring the actual impact or value of those deployments.
Metric - Lead Time for Changes
Lead Time for Changes measures the time taken from a code commit to that code running successfully in production.
What It Measures
Lead Time for Changes measures the total time it takes for a committed change to be successfully running in production. This starts from the moment a developer commits code to version control and ends when that change is deployed and available to end-users. It encompasses all stages of the delivery pipeline: coding, testing, review, build, and deployment.
Why It Matters
This metric is a direct measure of an organization's agility and its ability to quickly respond to market demands, customer feedback, and competitive pressures. A shorter lead time means faster feedback loops, enabling teams to iterate rapidly, experiment more, and deliver value incrementally. It signifies an efficient, streamlined delivery pipeline with minimal bottlenecks and waste. When lead times are short, organizations can adapt quickly to changes, reducing the risk of investing in features that don't meet user needs.
What It Does Not Measure
Lead Time for Changes does not measure the actual time spent coding or the sheer effort put in by developers. A developer might spend weeks on a complex feature, but if the pipeline is efficient, the lead time from commit to production could still be very short. The metric focuses on the flow through the system, not the effort within each stage.
Common Misinterpretations
A common pitfall is to optimize only isolated parts of the lead time, such as purely focusing on reducing build times. While faster builds are good, they might not be the primary bottleneck. The biggest contributors to long lead times are often waiting states: manual approvals, slow code reviews, inefficient testing processes, or environments that are difficult to provision. Ignoring these "waiting states" in favor of micro-optimizing automated stages misses the larger opportunity for improvement. Understanding the entire value stream is crucial.
Metric - Change Failure Rate
Change Failure Rate measures the percentage of deployments that result in degraded service, incidents, or require rollback or hotfixes.
What It Measures
Change Failure Rate (CFR) is the percentage of deployments to production that result in a degraded service, requiring remediation (e.g., a rollback, a hotfix, or a patch). This metric directly assesses the quality and reliability of the software delivery process and the stability of the system itself.
Why It Matters
CFR is a critical indicator of delivery quality and system resilience. A low change failure rate suggests robust testing, effective deployment practices, and a clear understanding of system dependencies. It demonstrates an organization's ability to introduce changes with confidence, minimizing disruptions to users and business operations. When CFR is high, it erodes trust, increases operational overhead, and slows down the delivery process as teams become more cautious and hesitant to deploy. The DORA research has consistently shown that organizations with lower change failure rates are often those that deploy more frequently, as smaller changes inherently carry less risk.
What It Does Not Measure
CFR does not measure the absolute number of defects in a codebase or the competence of individual team members. A high CFR points to systemic issues within the delivery pipeline, testing strategy, or operational practices, rather than blaming individuals. It’s a measure of deployment quality, not overall code quality in a static sense.
Common Misinterpretations
One dangerous misinterpretation is "fear-driven under-deployment." If CFR is high, some organizations might respond by deploying less often, believing that fewer deployments mean fewer failures. However, this often leads to larger, riskier deployments, exacerbating the problem. The correct response is to reduce batch size and improve deployment practices to lower the rate of failure, not just the number of deployments. Another pitfall is "hiding failures" through reclassification or by only counting major outages. For a true picture, any deployment requiring immediate remediation should be counted.
Metric - Mean Time to Recovery (MTTR)
MTTR measures how long it takes to restore service after a production incident occurs.
What It Measures
Mean Time to Recovery (MTTR) measures the average time it takes to restore service after a disruption or incident. This begins when an incident is detected and ends when the service is fully operational and healthy again. MTTR reflects an organization's ability to quickly detect, diagnose, and resolve production issues.
Why It Matters
MTTR is a crucial metric for organizational resilience and operational excellence. A low MTTR indicates that an organization has effective monitoring, robust incident response procedures, well-trained teams, and typically, systems designed for rapid recovery (e.g., easy rollbacks, highly observable architectures). When MTTR is low, the impact of failures on users and the business is minimized, building trust and confidence in the system. It signifies a mature incident management capability, where teams can quickly restore service even if preventing all failures is impossible.
What It Does Not Measure
MTTR does not measure the elimination of root causes or promise system perfection. It acknowledges that incidents will happen and focuses on how quickly an organization can recover from them. Nor does it specifically measure the initial detection latency—while critical, detection is a precursor to recovery time.
Common Misinterpretations
A common error is treating MTTR as purely an "operations" metric, separate from development. In a truly DevOps environment, developers play a key role in designing observable systems, participating in on-call rotations, and contributing to incident resolution. Ignoring detection latency is another trap; if an incident goes unnoticed for hours before recovery begins, a seemingly good MTTR might be misleading. The overall "time to restore" from incident start to resolution is the true measure of impact.
How the Four Metrics Work Together
A common misconception is that speed and stability must be traded off. DORA research consistently disproves this.
High-performing organizations:
- Deploy frequently
- Have short lead times
- Experience fewer failures
- Recover quickly when failures occur
This is possible because improvements target systemic constraints, not local optimizations. Automation, observability, trunk-based development, and platform enablement improve multiple metrics simultaneously.
When you increase Deployment Frequency and decrease Lead Time for Changes, you are essentially working with smaller batch sizes. Smaller batches are easier to test, easier to review, and carry significantly less risk. Consequently, this leads to a lower Change Failure Rate. If a failure does occur, the fact that the change was small makes it much easier to identify the cause, leading to a faster Mean Time to Recovery.
Optimizing one metric in isolation often degrades others. For example, reducing failure rate by deploying less frequently increases lead time and recovery complexity.
What DORA Metrics Reveal About Your Delivery System
DORA metrics act as a high-level diagnostic of your organizational health. They often act as a "smoke detector" for deeper systemic issues:
- Organizational Bottlenecks: A long Lead Time often points to "hand-off" delays between departments (e.g., waiting weeks for a security review or a QA sign-off).
- Approval and Governance Friction: If Deployment Frequency is low but Lead Time is high, it usually reveals heavy-weight manual change advisory boards (CABs) that stifle flow.
- Platform Maturity: High MTTR and Change Failure Rates often suggest a lack of automated environment provisioning and poor observability—signs of an immature internal platform.
- Team Autonomy and Cognitive Load: Teams that cannot improve their metrics despite effort are often hampered by high cognitive load—perhaps they are managing too many legacy services or lack the autonomy to change their own deployment pipelines.
What DORA Metrics Do Not Tell You
While powerful, DORA metrics are not a "silver bullet" for understanding everything about a business. It is vital to remember what they are not:
- Not Individual Performance Metrics: DORA measures the pipe, not the plumber. Using these to rank individual engineers is a recipe for toxic culture and "gaming" the system.
- Not Capacity Planning Tools: They don't tell you how many people you need to hire or if your roadmap is too full.
- Not Financial Metrics: High delivery performance doesn't guarantee a successful product-market fit or profitability.
Why misuse causes harm: When DORA metrics are used as targets or "KPIs" tied to bonuses, teams will naturally find ways to inflate the numbers (e.g., splitting one feature into ten tiny, meaningless deployments). This destroys the metrics' value as a diagnostic tool. To get the full picture, DORA must be complemented by qualitative signals like developer satisfaction surveys, user feedback and architectural health..
Using DORA Metrics Responsibly
To use DORA metrics effectively, leadership must foster a generative, high-trust culture. This means focusing on systems, not people.
- Trends over Targets: Instead of saying "We must hit 10 deploys a day," ask "Why is our deployment frequency trending down this month?" The value is in the direction of travel and the conversation it sparks.
- Contextual Interpretation: A team working on a legacy mainframe system will have different "good" metrics than a team building a greenfield serverless mobile API. Compare a team against its own history, not against other teams.
- Transparency without Weaponization: Data should be visible to everyone so that teams can use it for their own continuous improvement, rather than feeling like they are being watched by "Big Brother."
Key Takeaways
- Balance is King: The four metrics measure flow (Speed) and stability (Reliability) as a single, inseparable system.
- Systemic Focus: Improving DORA scores requires changing processes, architecture, and culture, not working "harder" as individuals.
- Communication Tool: Metrics are for starting conversations—"What is blocking us?"—not for exercising top-down control.
- Continuous Evolution: Elite performance is not a destination but a continuous practice of identifying and removing the next bottleneck in your delivery pipeline.
DORA metrics expose the health of the delivery system, not the heroics of the people inside it.
Disclaimer: This post provides general information and is not tailored to any specific individual or entity. It includes only publicly available information for general awareness purposes. Do not warrant that this post is free from errors or omissions. Views are personal.